
About a year ago I earned a master’s degree in computer science. A few years before that I found myself starting a data driven poker software business: https://nextgenerationpoker.com. We improved upon the status quo with a live session tracker and combined it with a state-of-the-art range-based odds calculator. This means that you can calculate equites for hands and ranges while playing live!
We tested 5.5 billion hands to build a dataset that powers a pre-flop range slider. Using this data and the range slider, you can test any contiguous sample of the linear hand space. As input, the model needs to know the exact order of every combination of pre-flop starting hand.
This was trivial for Texas Hold’Em. But Omaha was another beast entirely. There are only 1,326 combinations of Texas Hold’Em starting hands. Using combinatorics this is C(n,r) where n=52 and r=2. But there are C(52,4) = 270,725 combinations of Omaha starting hands. We tested each Texas Hold’Em hand 100,000 times, which only took four and a half hours. The 100,000 hands were way past any figures we found significant for convergence. Whereas for the Omaha simulation, testing each starting hand 20,000 times took five months.
Intuitively, we know that in Texas Hold’Em you can play any combination of five cards from the seven cards available to you (five on the board and two in your hand, C(7, 5) = 21 five-card hands). Unlike Hold’Em, with Omaha however, you start with four cards, and you have to use three from the board and two from your hand. This means that you can make 60 different combinations of five-card hands (C(5,3) * C(4,2) = 60).
Once the cards fell where they may, the best pre-flop hand was not what we expected. Most people don’t guess much of anything besides AAKK and AAJT (both double-suited). But three of the top four best hands from our simulation were AATT (again, double-suited). You can see more of our results here.
After sorting by win percentage, one of the next things that we did was to visualize our data.
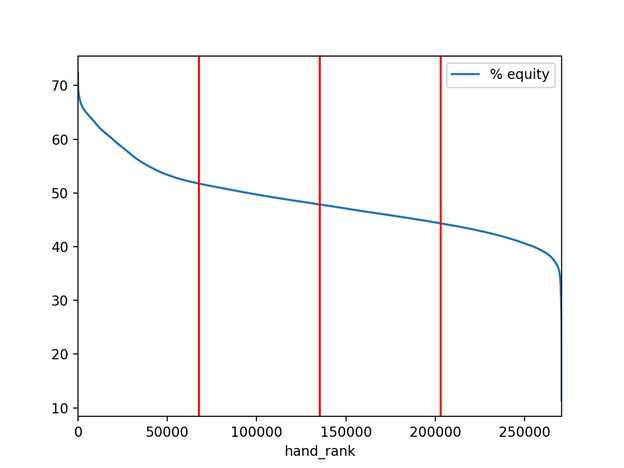
We were shocked. This time because our wild dataset appeared to be a perfect linear transformation of the famous Sigmoid Curve used in logistic regression and other applications. As you can see, there is an inflection point around the 35,000th – 40,000th best hand. And for the middle 200,000 or so hands, the difference in equity is not that much.
Unlike the Omaha hands, the slope of the top 10 or 20% of Texas Hold’Em hands has a much steeper decline.
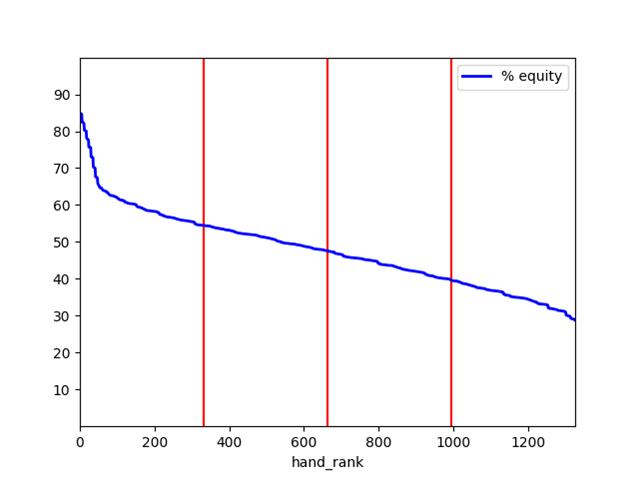
This is probably because the big pairs in Hold’Em are a much better favorite than the best hands in Omaha. In other words, Hold’Em ranges are much more polarized. Unless you share cards with your opponent, you are not often dominated in Omaha. In Hold’Em however, you can be quite far behind. With AA winning over 80% of the time (our exact figure for how often AA wins is 85.1925%, (85.31 + 85.2 + 85.14 + 85.12) / 4). It is also interesting to note that the worst hand in Hold’Em fares better than the worst hand in Omaha.
We found this so interesting that we built a website where you can query our data. Either provide a hand ranking and get back a hand and its equity, what is the 42nd best hand in Hold’Em? 8h8s according to our data. Or provide a hand and get back its ranking and equity. Four aces for example, is the 61,610th best hand in Omaha, and it wins 52.2% of the time against a random hand. You can query the Omaha database here and the Texas Hold’Em database here.
All of this is interesting. As are our results by quartile and top-ten lists. But really, this data is just a starting point for our odds calculator. When someone wants to model a specific hand or range post-flop, they should use the app.
The app was built to model a hand vs a hand, a hand vs a range, or a range vs a range, on your mobile device. You can play a live hand, fold the next one, go back, and model the hand you just played. This means that you can tighten your self-improvement loop and get nearly instant feedback.
The odds calculator requires the user to define several parameters: the game — Texas or Omaha, the model — hand vs hand, hand vs range, or range vs range, and the number of iterations – options vary from 100 to 500,000. The first two are straight forward. But there are specific things to consider when choosing a number of iterations.
For instance, since there are only 1,326 starting hands in Texas Hold’Em, you wouldn’t want to spend time repeating tests for your Monte Carlo experiment 500,000 times. The numbers will have long since converged and you would have explored the entire hand space over 377 times. With Omaha having many more combinations of starting hands however, you would probably want to do at least 10,000 iterations. And just to be sure, you can kick that number up into the hundreds of thousands. But what about post flop?
Have you ever wondered how often someone that plays half the hands they are dealt out flops your Aces on a dry board? If we start with the top 50% of Texas Hold’Em starting hands, there are 27 combinations of hands that out-flop your Aces on a Qc9d5h board. And you have 20.2% equity against this range. Put another way, those 27 hands represent only 4.07% of your opponent’s pre-flop range. This means if they float the flop a lot, you almost never have anything to worry about with two Aces. If we add all open-ended-straight-draws into this range, there are now 43 combinations of hands, and your equity goes up against this new range (36.61%, up from 20.2%).
You can repeat this process and continue to narrow your opponent’s range by stepping through each street, or you can jump to a specific situation on a specific street.
Interested in more spots, or have any questions? You can get a hold of us on social media:
Happy hunting and good luck,
Andrew Emory
Founder & CEO NextGenPoker